Animate
Animate[expr_, {u_Symbol, min_, max_}, opts___]
Animate[expr_, {u_Symbol, min_, max_, step_}, opts___]
generates a version of expr allowing automatic repeated reevaluation for each u though min, max with a defined frame rate.
Please consider to use AnimatePlot for basic animated plots or use low-level tools: Offload and AnimationFrameListener.
Animate uses Just-In-Time transpilation of expressions to optimized ones. It might not work in all cases and may fall back to full reevaluation.
Examples
Symbolic expressions
Animate[Row[{Sin[x], "==", Series[Sin[x], {x,0,n}], Invisible[1/2]}], {n, 1, 10, 1}, RefreshRate->3]

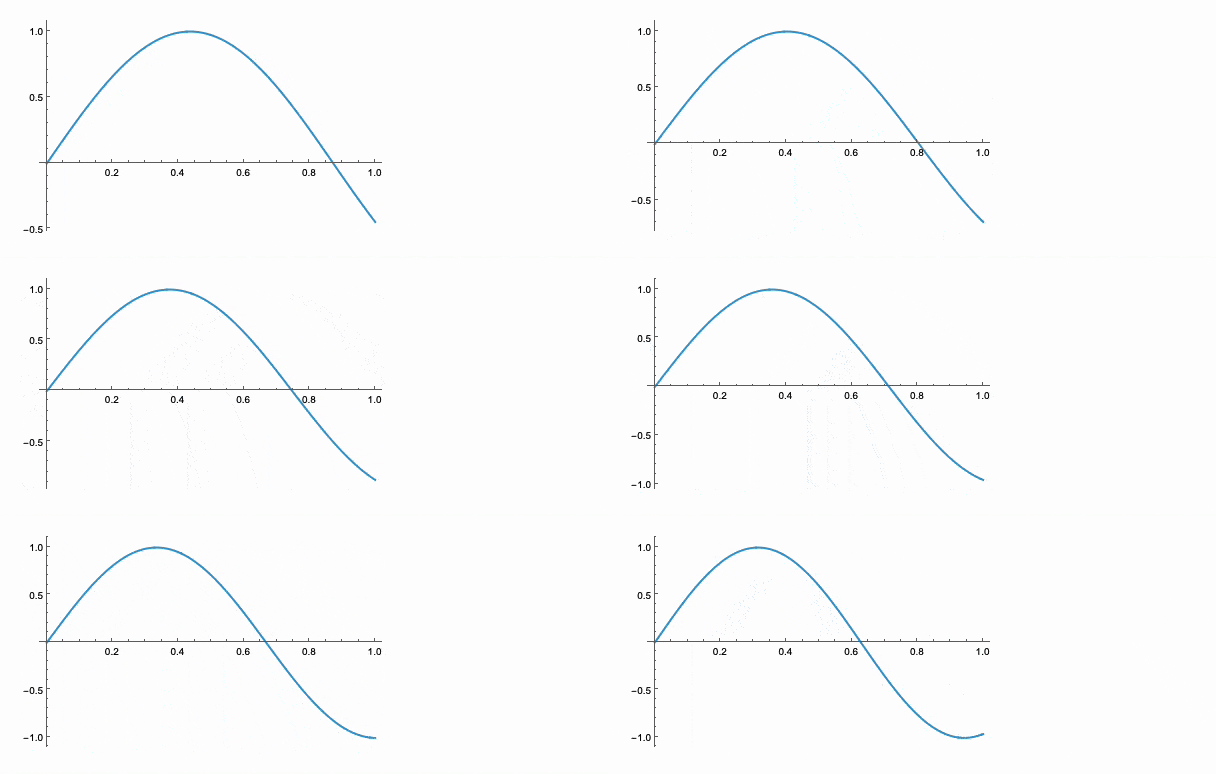
Animate Plot expression
Animate[Plot[1.0 + Sin[w] Sin[x + w],{x,0,5Pi}, Epilog->{
  Red, Point[{8.0, 1.0 + Sin[w] Sin[8.0 + w]}]
}], {w,0,Pi}]
Spinograph
Animate Plot3D expression
w3D[x_,y_,t_] := Total@Table[With[{kx = 1.0 \[Omega], ky = 1.0 \[Omega]},
  Cos[ kx x + ky y - \[Omega] t]
], {\[Omega], 0, 3, 1.0}];

Animate[Plot3D[w3D[x,y,t], {x,-Pi,Pi}, {y,-Pi,Pi}, MaxRecursion->0, Mesh->None, PlotRange->Full], {t,0,5}]
Here we tried to lower the computation costs by reducing mesh quality, so that the animation can be played with higher FPS
JIT Transpiler
Animate as well as Manipulate uses a diff algorithm that detects and tries to convert manipulated expressions to a more optimized dynamic ones using a low-level Offload technique.
If something else goes wrong, it will deoptimize it back and send an original expression to the output.
Our transpiler does not cover all symbols and is limited to the following for now:
Line,Point,Polygon,Tube,Arrow,Disk,Circle,Sphere,Cuboid,Rectangle,TextGraphicsComplexin the context ofGraphics3DImagePlotLabelin the context ofGraphicsLineLegend,PointLegend,SwatchLegend
which is a good subset to cover the output produced by Plot, Plot3D and many others standard functions. What will not be supported in the near future:
PlotRangemutations are ignored- adding/removing
Line,Pointand etc primitives at runtime leads to deoptimization - changing color or opacity leads to deoptimization
Tips for better performance
If you still want to use Animate on some complex expressions, there are some tricks to avoid deoptimization of JIT engine
- Try to keep the number of curves/traces/polygons expressions the same if possible. Try not to add new entities to your graphs.
PerformanceGoal->"Speed"is also a good option for 3D plots.Mesh->Nonemight also help.PlotRange->Fullcan help to avoid fragmentation of line segments- Avoid changing colors, opacity on runtime
In any case you can still animate anything with a great performance using low-level building blocks Offload and AnimationFrameListener.
See Animation in Advanced section
Portability
The same as for Manipulate. Animate widgets can be exported to Interactive HTML or MDX in automatic mode.
Please do not use infinite AnimationRepetitions
Exporting as GIF or video
This feature is only available for WLJS Notebook desktop application, since we rely on our custom Electron.js raster renderer
You can wrap Animate, AnimatePlot, AnimateParametericPlot expressions with AnimatedImage to rasterize them into the series of images and export to a file as GIF or video
Export["animation.gif", AnimatedImage @ Animate[
	Plot[Sinc[x z], {x,0,4Pi}]
, {z,1,5}, RefreshRate->25] ]
where AnimatedImage can be extended with options alike Rasterize
Options
FrameRateplayback speed (does not affect rasterization). By the default is taken fromAnimateoptions (asRefhreshRateorAnimationRate)"Window"by the default is CurrentWindow"ExposureTime"sets waiting time before each frame is captured. By the default it isAutomaticand the actual values is taken from the animation rate of the widget"Asynchronous"sets async rasterization mode, where the constructor returnsPromiseimmediately. By the default isFalse.
In the same way it can be exported to ByteArray or Base64 string:
ExportByteArray[AnimatedImage[...], "GIF"]
ExportString[AnimatedImage[...], {"Base64", "GIF"}]
Also Video object can be directly derived from AnimatedImage:
Video[AnimatedImage[...]]
MMAView
MMAView wrapper allows to use native Wolfram Engine rendering engine for animating expressions, any expression. It uses a parallel kernel to rasterize the provided expression and stream updates to the frontend.
Animate[Plot[Sin[x y], {x,0,1}], {y,0,5}] // MMAView

Options
RefreshRate
Sets the number of frames per second for which animation is being evaluated and played. The default is 12
AnimationRate
Specifies units or steps per second. By the default is Automatic. If set to a numeric value, it will effectively overwrite the step size of the iterator.
"TriggerEvent"
Specifies an EventObject used to start an animation (or restart) externally (via a button for instance)
"UpdateFunction"
Allows to alter the data generated on update or cause user-defined side-effects. The following values are expected
Function[u,
	(* side effects *)
	(* RETURN *)
	True <- accept change
	False <- prevent default
	_String <- will be written instead to the output expr
]
One can bypass the default method completely and rely on side effects
Module[{pts},
  Animate[Graphics[{
    Circle[{0,0},1],
    Red, Point[pts // Offload]
  }, ImageSize->Small], {t, 0, 2Pi, 0.1}, "UpdateFunction" -> Function[t,
    pts = {Sin[t], Cos[t]};
    False
  ]]
]
Appearance
By the default is Automatic. Change to None or False to remove extra information.