ManipulatePlot
ManipulatePlot[f_, {t, min, max}, {p1, min, max}, ..., opts___]
a dynamic alternative to Plot and Mathematica's Manipulate, that uses input elements and Offload technic to make a fast interactive plots of a given function f[t, p1, p2...]
the set of parameters are not limited and accepts the following forms
ManipulatePlot[f_, {t, min, max}, {p1}, {p2}, ...]
ManipulatePlot[f_, {t, min, max}, {p1, min, max}, {p2}, ...]
ManipulatePlot[f_, {t, min, max}, {p1, min, max, step}, {p2}, ...]
ManipulatePlot[f_, {t, min, max}, {{p1, initial}, min, max}, {p2}, ...]
ManipulatePlot[f_, {t, min, max}, {{p1, initial, label}, min, max}, {p2}, ...]
ManipulatePlot[f_, {t, min, max}, {p1, values_List}, {p2}, ...]
ManipulatePlot[f_, {t, min, max}, {{p1, initial}, values_List}, {p2}, ...]
ManipulatePlot[f_, {t, min, max}, {{p1, initial, label}, values_List}, {p2}, ...]
where f can return _Real or {__Real}
Options
"SamplingPoints"
A number of points used in sampling. The default value is 200
It inherits some of Graphics options as well
TransitionType
See TransitionType
TransitionDuration
ImageSize
Accepts {width, height}
PlotStyle
Specifies colors for each curve
Appearance
By the default is "Default". Set it to None to remove the frame and info boxes.
"ControlsLayout"
By the default is "Vertical", another possible value is "Horisontal"
Epilog
Prolog
Appends graphics primitives to the plot. See Graphics
"UpdateFunction"
Allows to alter the data generated on update or cause user-defined side-effects. The following values are expected
Function[input,
	(* side effects *)
	(* RETURN *)
	True <- accept change
	False <- prevent default
	_ <- will be written instead
]
This allows to add extra dynamic features to your plot nicely
Module[{label, pos},
  ManipulatePlot[x w, {x,0,1}, {w,0,2},
    Epilog->Text[label // Offload, pos // Offload],
    "UpdateFunction" -> Function[input,
      label = StringTemplate["w = ``"][input];
      pos = {0.5, input 0.5 + 0.2};
      True
    ]
  ]
]
"TrackedExpression"
Similar to the option of InputRange. It provides an external control over the sliders. Your expression must be an array of values with a length equal to the number of controlling parameters. For example
woo = {0.5, 0.6};

ManipulatePlot[Sin[ w x^2 + u], {x,0,10}, {w, 0, 1},{u, 0,1}, "TrackedExpression"->Offload[woo]]
now you can update it by setting a new value
woo = {0.3, 0.2, 1.3}
Example
Plot the simplest sine function
ManipulatePlot[Sin[w z + p], {z,0,10}, {w, 0, 15.1, 1}, {p, 0, Pi, 0.1}]
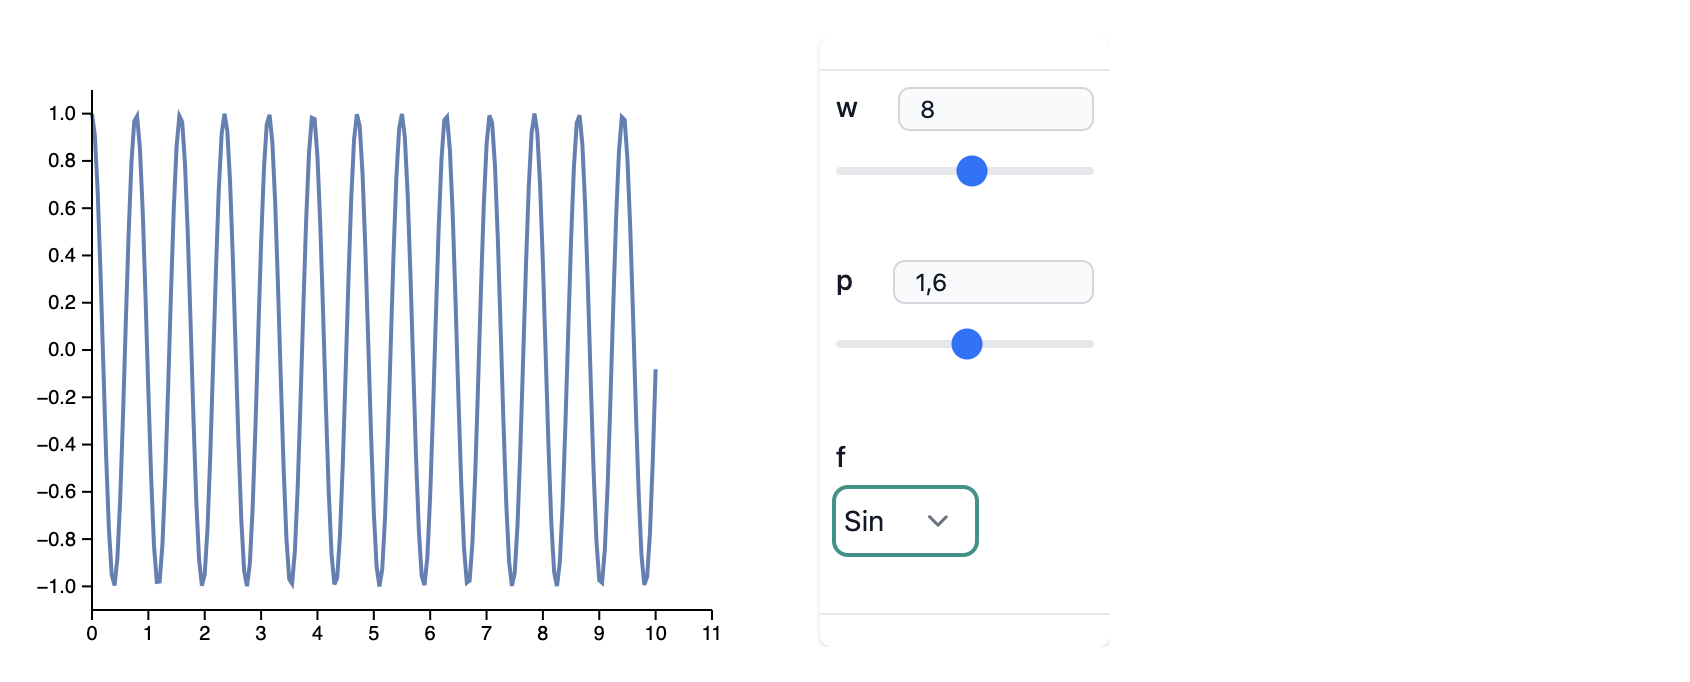
Or give a choice to a user
ManipulatePlot[f[w z + p], {z,0,10}, {w, 0, 15.1, 1}, {p, 0, Pi, 0.1}, {f, {Sin, Cos}}]
Supported output forms
Portability
It can be automatically exported to Interactive HTML or MDX in automatic mode.
Issues
Help needed!
There is no adaptive sampling implemented.