Plotly
Plotly[f, {x, xmin, xmax}]
mimics the behavior of a native Plot using a well-known PlotlyJS library. It is quite limited and does not support options.
Plotly[data_Association, layout_Association:Null] _PlotlyInstance
creates Plotly instance object, which gives a direct API access to a native Plotly Javascript engine ✨ and returns PlotlyInstance
data expression contains the parameters of a default Plotly Javascript constructor
This is 1:1 correspondence to a normal Plotly API. Please see Reference
RGBColor will also work normally as well as ColorData for coloring the plots. There is no need in JS/CSS-like color specifications
Constructor
Once called it returns PlotlyInstance
Options
ImageSize
Sets the image size effectively writing width and height to layout properties.
Dynamics
It fully supports dynamics, but in a different way compared to other functions. Please see for that PlotlyAddTraces, PlotlyAnimate and etc.
Multiple copies of the same instance cannot be used in dynamics. Only the last one will be updated. PlotlyInstance automatically tracks its window.
Examples
Scatter plot
Adapted from Ref.
trace1 = <|
	"x" -> {1, 2, 3, 4},
	"y" -> {10, 15, 13, 17},
	"mode" -> "markers",
	"type" -> "scatter"
|>;

Plotly[trace1]

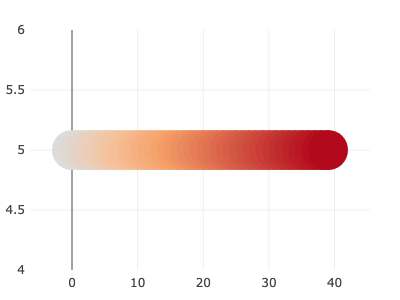
or with colors
trace1 = <|
	"y" -> Table[5, {i, 1, 40}],
	"mode" -> "markers",
	"marker" -> <|
		"size" -> 40,
		"color" -> Range[40]
	|>
|>;

Plotly[trace1]
Line charts
Adapted from Ref
trace1 = <|
	"x" -> {1, 2, 3, 4},
	"y" -> {10, 15, 13, 17},
	"type" -> "line"
|>;

Plotly[trace1]

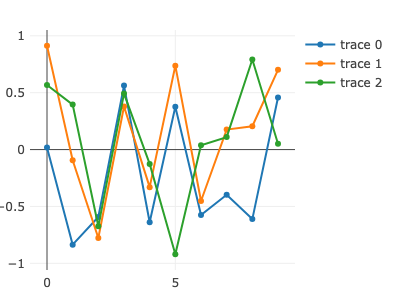
or an array of traces
trace := <|
	"y" -> RandomReal[{-1,1}, 10],
	"type" -> "line"
|>;

Plotly[{trace, trace, trace}]
Bar plot
Adapted from PlotlyJS
trace = <|
	"x" -> {"giraffes", "orangutans", "monkeys"},
	"y" -> {20, 14, 23}, "type" -> "bar"
|>;

Plotly[trace]

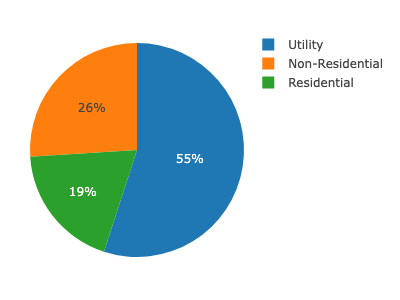
Pie chart
Adapted from PlotlyJS
trace = <|
	"values" -> {19, 26, 55},
	"labels" -> {"Residential", "Non-Residential", "Utility"},
	"type" -> "pie"
|>;

Plotly[trace]
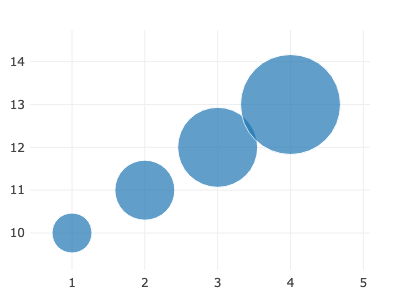
Bubble chart
Adapted from PlotlyJS
data = <|
	"x" -> {1, 2, 3, 4},
	"y" -> {10, 11, 12, 13},
	"mode" -> "markers",
	"marker" -> <| "size" -> {40, 60, 80, 100} |>
|>;

Plotly[data]
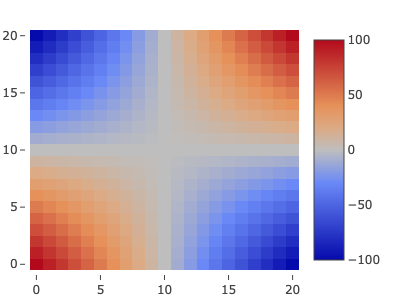
Heatmaps
Adapted from PlotlyJS
data = <|
	"z" -> Table[x y, {x,-10,10}, {y,-10,10}],
	"type" -> "heatmap"
|>;

Plotly[data]
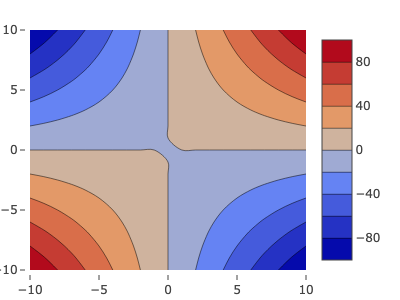
Contour Plots
Adapted from PlotlyJS
data = Flatten[Table[{x,y,x y}, {x,-10,10}, {y,-10,10}],1] // Transpose;

data = <|
    "x" -> data[[1]],
    "y" -> data[[2]],
	"z" -> data[[3]],
	"type" -> "contour"
|>;

Plotly[data]
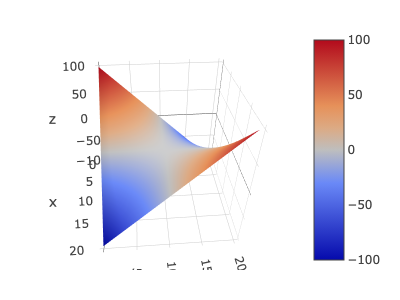
Surface plot
Adapted from PlotlyJS
data = <|
	"z" -> Table[x y, {x,-10,10}, {y,-10,10}],
	"type" -> "surface"
|>;

Plotly[data]
WebGL Scatter
A GPU accelerated scatter plot used for displaying many points
data = RandomReal[{-1,1}, {2,100000}];

Plotly[<|
  "y" -> data[[2]],
  "x" -> data[[1]],
  "mode"-> "markers",
  "type"-> "scattergl"
|>]
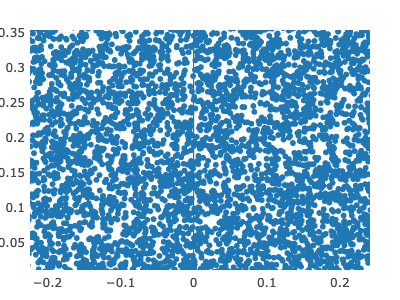
50x zoom
Many more!
Please visit PlotlyJS website
TODO
Developers notes
- Integrate events system with click events and others...