Indicators
While evaluating experimental data, some live indicators come in handy.
Crossbar and Coordinates Field
If you are an Origin Pro user, this is an essential tool for picking data points from your graph.
Essentially, we need two things: Line and TextView.
Normal Way
point = {0.,0.};
(* Plot some dummy function *)
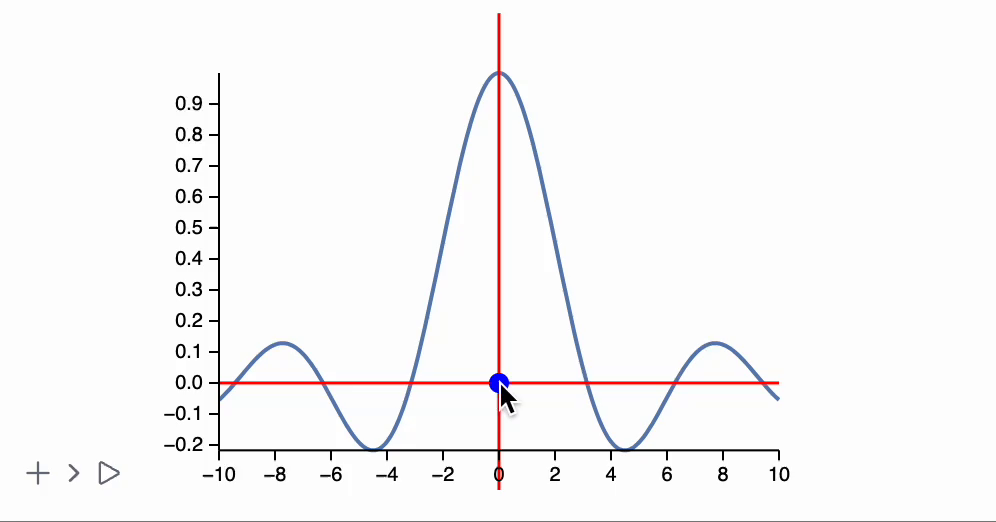
Plot[Sinc[x], {x,-10,10}, Epilog->{
Red,
(* Crossbar *)
Line[With[{p = point[[1]]},
{{p, -10}, {p, 10}}
] // Offload],
Line[With[{p = point[[2]]},
{{-10, p}, {10, p}}
] // Offload],
(* Attach listener *)
EventHandler[Null, {
"mousemove" -> Function[xy, point = xy]
}]
}]
This attaches an EventHandler to a Null expression, which forces it to seek the nearest parent that emits events, i.e., Graphics. Every time the user moves the mouse over it, the event handler is triggered, updating the point symbol, which causes the lines to update accordingly.
You can reduce lag by tuning TransitionDuration to a lower value.
Now, the text field:
TextView[point // Offload]
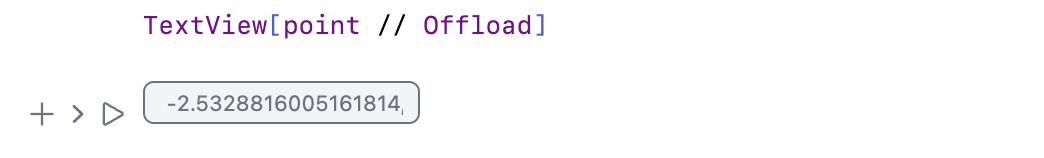
The accuracy might be too large. We can output the values separately by using another variable or symbol:
point = {0.,0.};
text = " ";
(* Plot some dummy function *)
Plot[Sinc[x], {x,-10,10}, Epilog->{
Red,
(* Crossbar *)
Line[With[{p = point[[1]]},
{{p, -10}, {p, 10}}
] // Offload],
Line[With[{p = point[[2]]},
{{-10, p}, {10, p}}
] // Offload],
EventHandler[Null, {
"mousemove" -> Function[xy,
point = xy;
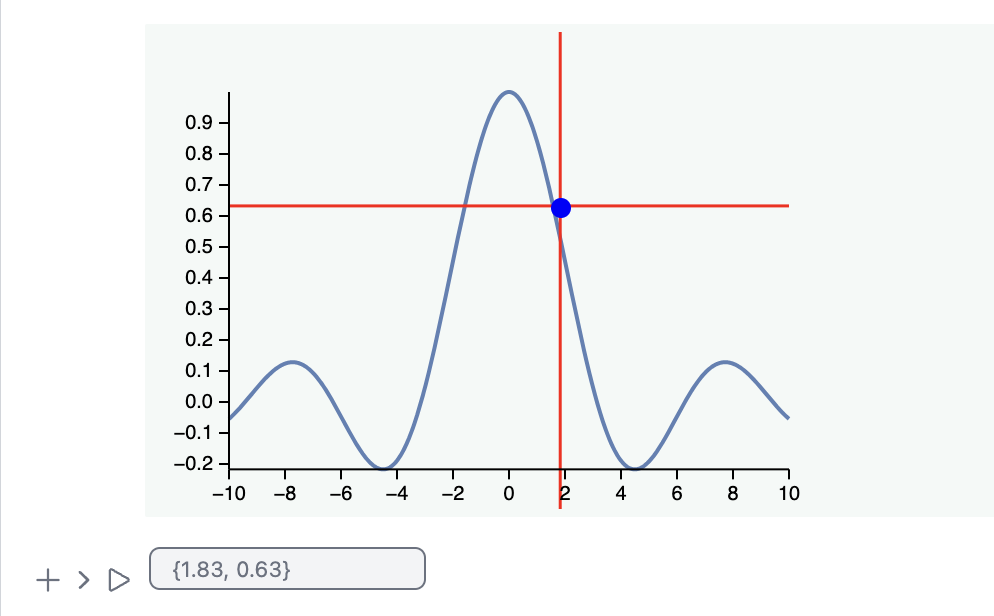
text = ToString[Round[xy, 0.01]];
]
}]
}]
TextView[text // Offload]
Now it is much better.
Dynamically Appending to a Plot
One can also append it to a plot dynamically afterward using FrontInstanceReference. Sometimes this approach is better since all variables remain scoped.
placeCrossbar[ref_, pos_:{0.,0.}] := LeakyModule[{point = pos, text = ""},
  FrontSubmit[{
    Red,

    (* Crossbar *)
    Line[With[{p = point[[1]]},
      {{p, -10}, {p, 10}}
    ] // Offload],

    Line[With[{p = point[[2]]},
      {{-10, p}, {10, p}}
    ] // Offload],

    EventHandler[Null, {
    "mousemove" -> Function[xy,
        point = xy;
        text = ToString[Round[xy, 0.01]];
    ]
  }]
  }, ref];

  TextView[text // Offload]
]
Now, the only thing we need is to scope it:
(* Plot some dummy function *)
ref = FrontInstanceReference[];
Plot[Sinc[x], {x,-10,10}, Epilog->{ref}]
After evaluation, we can append it:
placeCrossbar[ref]
Progress Bar
During a long evaluation process, we need some sort of indication. For this, we need a few elements: Rectangle and CellPrint.
One can think of it as a typical OOP approach. We need a constructor that returns an instance for tracking the evaluation progress:
progressBar[max_Real | max_Integer] := LeakyModule[{
    progress = 0.,
    bar,
    increment,
    timer = AbsoluteTime[]
},
    bar = CellPrint[ToString[
        Graphics[{
            LightBlue, Rectangle[{-1,-1}, {1,1}],
            Green, Rectangle[{-1,-1}, {Offload[2 progress - 1], 1}]
        }, ImagePadding->None, ImageSize->{400, 30}]
    , StandardForm], "After"->EvaluationCell[]];

    (* Throttling *)
    increment[value_Real | value_Integer] := If[AbsoluteTime[] - timer > 0.1,
        timer = AbsoluteTime[];
        progress = value / max // N;
        If[progress >= 0.99,
            ClearAll[increment];
            Delete[bar];
        ];
    ];

    increment
]
Here, we also use a throttling mechanism to avoid overloading the frontend if our progress-tracking function is called too often. The progress bar itself is printed in another cell as a growing green rectangle.
Let’s try to use it:
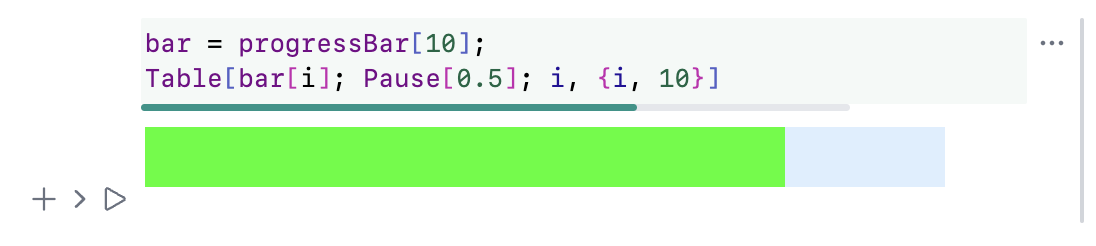
bar = progressBar[10];
Table[bar[i]; Pause[0.5]; i, {i, 10}]