Slides
You can use pure Markdown, HTML, CSS, or WLX languages when creating slides.
Slides cells are powered by wljs-revealjs, which integrates the amazing RevealJS framework and the WLX language. It enables a component-based approach to creating presentations, adding interactivity, and leveraging all the features of frontend cells.
The goal of this approach is to simplify slide creation, separate content from appearance, and embrace data-driven presentations.
If you know the basics of Markdown, you're already capable of doing a lot:
.slide

# Title

Content
Slides can be separated in two ways:
- Using
---within the same cell:
.slide

# Slide 1

---

# Slide 2
This method is simple but can become unreadable with larger slides.
- Using separate cells:
.slide

# Slide 1
.slide

# Slide 2
You can then merge them using the .slides extension:
.slides

This could be the final slide. All previous slides will be added before.
The position of the .slides cell in the notebook does not affect the presentation order.
To enter fullscreen mode, press the f key after focusing on the slide content.
Use the projector feature:
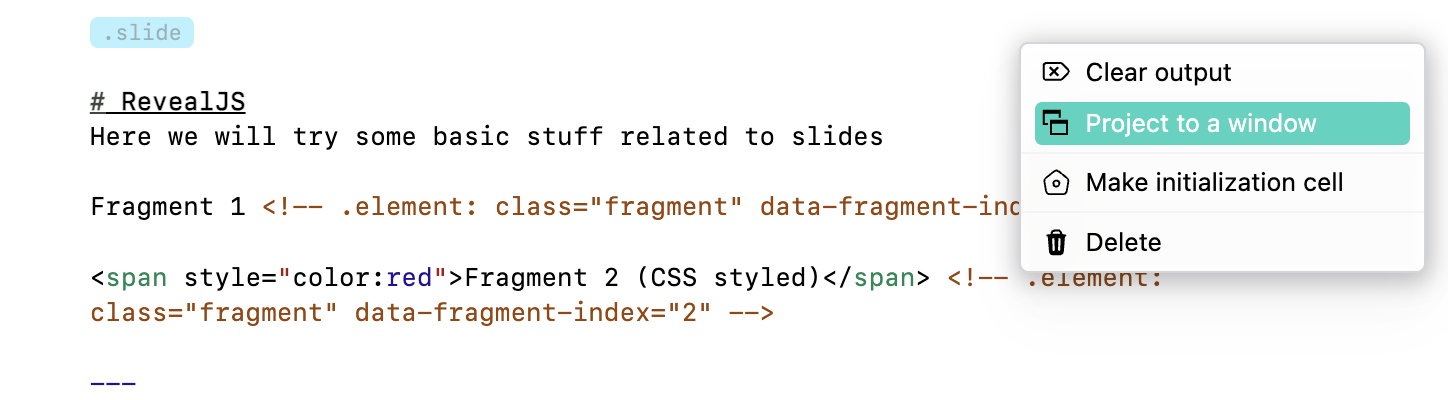
to show slides in a separate window.
Pointer
Pointer is provided by a RevealJS plugin. To toggle it, press q while focused on a slide:

PPT-like slide style
By the default slides are centered and its height depends on the content, you can set the class for a slide to get more PPT-like layout:
.slide

<!-- .slide: class="slide-standard" -->

# Title

Content

Here:
- text is aligned to the left side
- slide height is fixed to 100%
Scrollable slide
If the content is too large, but you still want to keep it on a single slide, one can tune the settings for a slide element
.slide

<!-- .slide: class="slide-standard-scroll" -->

## Title

<br/><br/><br/>
...large content goes
<br/><br/><br/>
...large content goes
<br/><br/><br/>
...large content goes
<br/><br/><br/>

<br/><br/><br/>
...large content goes

<br/><br/><br/>
...large content goes
<br/><br/><br/>
...large content goes
<br/><br/><br/>
...large content goes
<br/><br/><br/>
...large content goes
<br/><br/><br/>
...large content goes
Layout
This method is not opinionated about how you organize content on a slide. By default, titles marked with #, ##, etc., are centered and rendered with standard HTML h1, h2, etc. tags. Paragraphs are wrapped in p tags behind the scenes.
If you need two columns, use HTML and any method you prefer (e.g., flex):
.slide

# Title

<div style="display: flex">
  <div style="width: 50%">

## Subtitle 1

Some content

  </div>
  <div style="width: 50%">

## Subtitle 2

Some content

  </div>
</div>
To use Markdown within HTML, please add line breaks before and after.
The result will look like this:

To mix Markdown with HTML or WLX correctly, remove leading white space from Markdown headers:
.slide

<div>
	# It won't work
</div>
Instead, use:
.slide

<div>

# It will work

</div>
Using WLX
You can create helper functions for layout:
.wlx
Columns[Col1_, Col2_] := With[{},
	<div style="display: flex">
		<div style="width: 50%"><Col1/></div>
		<div style="width: 50%"><Col2/></div>
	</div>
]
And use them like this:
.slide

# Title

<Columns>
  <div>

## Subtitle 1

Some content

  </div>
  <div>

## Subtitle 2

Some content

  </div>
</Columns>
The result will be the same. The extra div tags help WLX distinguish between the first and second arguments of Columns, similar to how li and ul tags are used to make lists.
See the advanced guide on components: Building components
Full height, text align left
The standard Power Point's slide content alignment can be achieved using
.slide

<!-- .slide: style="height:100vh; text-align:left" -->

# Heading

Content
How to escape tags
To escape any XML-like tags inside WLX cell use Escape keyword:
.slide

# Heading

<Escape>
	It won't be parsed by WLX
</Escape>
Make a grid of images
Using grid display property of CSS, we can automatically align many images perfectly on the slide:
.slide
<div style="
display: grid;
grid-template-columns: repeat(auto-fill, minmax(400px, 2fr));
gap: 20px;
justify-content: center;
align-content: space-around;
align-items: baseline;
justify-items: center;
">


</div>
Here is how it looks on the slide

Images
RevealJS uses standard Markdown image syntax:
.slide
# Title


You can drag and drop images from anywhere:
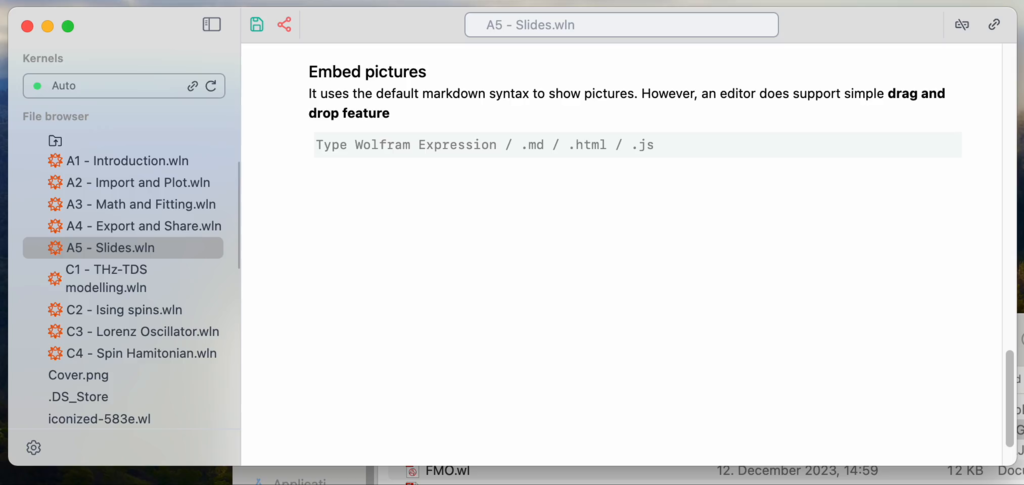
Local files are also supported:
.slide

A web server will look for example.png in the directory where the notebook is located. If not found, it will attempt to use it as a global path starting from the system root.
You can also use the regular HTML img tag to control size:
.slide

<img width="700" src="https://upload.wikimedia.org/wikipedia/en/a/a9/Example.jpg"/>
Equations
Equations are powered by the KaTeX library. Use LaTeX syntax:
.slide

$m \\mathbf{a} = \\mathbf{F}$
Single slashes are reserved by WL Kernel, so always use double slashes \\.
Multiline equations:
.slide

$$
\\begin{bmatrix}
 m \\mathbf{a} = \\mathbf{F}
\\end{bmatrix}
$$
To highlight WL code, JS, or HTML, see Code insets.
Escaping sequences
Since LaTeX is embedded into Markdown, you should escape the following sequences
Backslashes
To have full compatibility with Markdown syntax you have to escape all backslashes. For example, write \\alpha instead of \alpha.
Trailing underscores
To avoid misinterpretation for __ markdown command, you need to escape such cases. For example, instead of this
$$
\hat{\alpha}_{x} - \hat{\beta}_{}
$$
as a minimal patch one can escape the very last one ⤵️
$$
\hat{\alpha}_{x} - \hat{\beta}\_{}
$$
And the best solution would be 👍🏼
$$
\\hat{\alpha}\_{x} - \\hat{\\beta}\_{}
$$
See here for all supported LaTeX functions.
How to convert WL expression to LaTeX?
Using TeXForm one can do it almost in a single action. For example
RotationMatrix[120Degree, {0,0,1}]//MatrixForm //TeXForm
"\\left(\n\\begin{array}{ccc}\n -\\frac{1}{2} & -\\frac{\\sqrt{3}}{2} & 0 \\\\\n \\frac{\\sqrt{3}}{2} & -\\frac{1}{2} & 0 \\\\\n 0 & 0 & 1 \\\\\n\\end{array}\n\\right)\n"
Then remove line breaks \n and place it on a slide
.slide

# My Equation

$$
\\left(\\begin{array}{ccc} -\\frac{1}{2} & -\\frac{\\sqrt{3}}{2} & 0 \\\\ \\frac{\\sqrt{3}}{2} & -\\frac{1}{2} & 0 \\\\ 0 & 0 & 1 \\\\\\end{array}\\right)
$$
Excalidraw
Type !![] to spawn a live Excalidraw editor
.slide

# Title

!![]
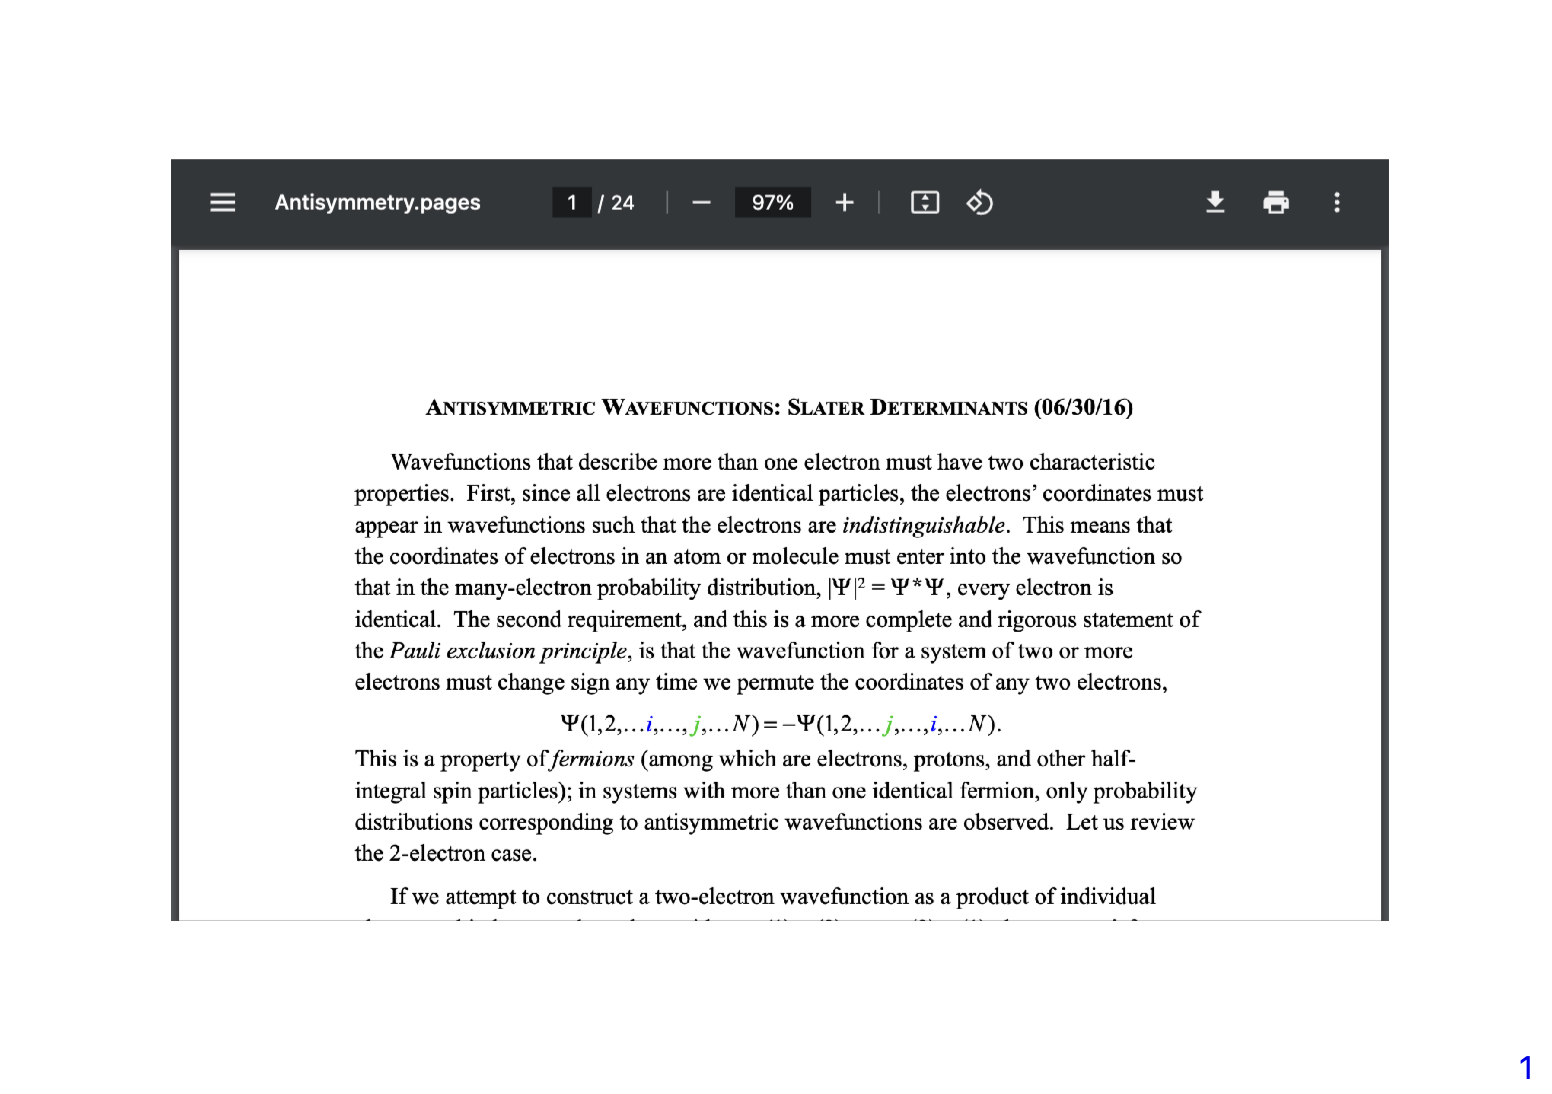
Embedding PDFs or Websites
With full HTML support, you can embed a local PDF:
.slide

<embed width="800" height="500" src="antisymmetry.pdf"/>
Or an entire website:
.slide

<iframe width="800" height="500" src="https://chat.openai.com"/>

For nicer corners:
.slide

<iframe style="border: none; border-radius: 4px" width="800" height="500" src="https://chat.openai.com"/>
Misc
The Marquee element
This element is used to insert a scrolling area of text. You can control what happens when the text reaches the edges of its content area using its attributes.
.slide

# Title

<marquee>Hello World</marquee>
Mark
This HTML element represents text which is marked or highlighted
.slide

# Title

<mark>salamander</mark>
Meter and progress
This element represents either a scalar value within a known range or a fractional value.
.slide

# Title


<label>Fuel level: </label>
<meter min="0" max="100" low="33" high="66" optimum="80" value="50">
  at 50/100
</meter>
.slide

# Title

<label>File progress: </label>
<progress max="100" value="70">70%</progress>
JavaScript Code
Any script tag will execute after slides are mounted:
.slide

<div id="dtext">Hello World</div>

<script>
  document.getElementById('dtext').style.background = "yellow"
</script>
If you use unique id for elements on the slide, please, remove the output cell before reevaluating the input one. Otherwise two identical elements might coexist on the same page, which then cause issues with bindings to JS.
Transitions and Fragments
To reveal content in stages, use HTML comments like:
<!-- .element: class="fragment ACTION" data-fragment-index="INDEX" -->
For example:
.slide

# Slide

Fragment disappears <!-- .element: class="fragment fade-out" data-fragment-index="1" -->

Fragment appears <!-- .element: class="fragment" data-fragment-index="2" -->

Fragment changes color <!-- .element: class="fragment highlight-red" data-fragment-index="3" -->
See more transitions at RevealJS.
Custom transitions are not supported unless created using Graphics and the animations method.
Events
To capture events such as slide or fragment reveals, use SlideEventListener:
.slide

# 1st Slide
Nothing

---

# 2nd Slide
A message pops up

Another message <!-- .element: class="fragment" data-fragment-index="1" -->

<SlideEventListener Id={"myEvent"}/>
Before evaluating, attach an event handler:
EventHandler["myEvent", {
	"Slide" -> (Print["Hey there!"]&),
	"fragment-1" -> (Print["Hey there from fragment!"]&)
}]
The identifier acts as an event object with these patterns:
"Slide"— fired when a slide is revealed"fragment-INDEX"— fired when a fragment is revealed
For more on animations and interactivity, see the animations section.
WL Expressions and Data-Driven Slides
You can run and embed any WL expressions directly on a slide:
GetTime := TextString[Now];
.slide

# Using WLX
You can do some cool stuff

Your local time is __<GetTime/>__

Embed graphics objects too:
Figure = SphericalPlot3D[SphericalHarmonicY[2,0, t,p], {t, 0, Pi}, {p, 0, 2Pi}];
.slide

# Embed some figures
Even 3D

<div style="text-align: center; display: inline-flex;">
  <Figure/>
</div>

Try moving it with your mouse
You can also plot data from a local CSV file. For example, plotting the shortest path through random points:
pts = RandomReal[10, {100, 2}];
Figure = ListLinePlot[pts[[Last@FindShortestTour[pts]]], Epilog->{Point[pts]}]
.slide

Compute and plot the shortest tour through 100 random points:

<Figure/>
For more advanced examples, see animations.