Release Notes *3.1.4*
docker run -it \
  -v ~/wljs:"/home/wljs/WLJS Notebooks" \
  -v ~/wljs/Licensing:/home/wljs/.WolframEngine/Licensing \
  -v ~/wljs/tmp:/tmp \
  -p 8000:3000 \
  --name wljs \
  ghcr.io/wljsteam/wljs-notebook:3.1.4
brew install --cask wljs-notebookLegends Styling
We now support additional styling options for plot legends:
LegendFunction(limited support)LegendLayoutLegendMarginsLabelStyleRoundingRadiusBackground
For example:
Plot[{x, 2x}, {x,0,1},
 PlotLegends->SwatchLegend[Automatic, {"x", "2x"},
   LegendFunction->"Panel"
 ]
]
(*VB[*)(Legended[ToExpression[FrontEndRef["F82846e8f-51e0-4a8f-9821-8284c7588dd2"], InputForm], Placed[SwatchLegend[{Directive[Opacity[1.], RGBColor[0.24, 0.6, 0.8], AbsoluteThickness[2]], Directive[Opacity[1.], RGBColor[0.95, 0.627, 0.1425], AbsoluteThickness[2]]}, {"x", "2x"}, LegendMarkers -> Automatic, LabelStyle -> {}, LegendFunction -> "Panel", LegendLayout -> "Column"], After, Identity]])(*,*)(*"1:eJylUs0uBEEQHv8/QfAAEgfHTVh/4yCTxRLJbhazce/pqaGjdUt3D7sP4CG4unkCZw/g4OIBuIhEeANVPcnK7sVBHb5Uar7+quqrmU/0UTYQBIGdRDgWcLUDXBvmtIlHsFKDE1BpuaCMI1RTgd+ImPVRbRZh12jlqiqttoDnjiUS4gUqh+VwZQ3CrLS6BIulFYbZRlheKlGdr6+GYYrK/aQyiHCU47tRSoClDSXbvto0OfRwaIwYJHDfyg5RKyYtFEMOIxxIxiHNKLUTxL5ijp8Wu/yK1YR1xZsxhB1hUFFcQrEXLd+4YFy4tgl8fEUF2Y+4t7WtpTbmYe764/DhKTLLPl4jc3tD8R4VMjMIlcRqmTtongp+psBaQSP8t3Pm4zMy99/P9WT6LTKb4y93F5uPf3fuciAmdiumWrnV7bT/JwrX6sycgbF+3kru9Dlzgvew6S41loCMXVtCFnT53E2d6gjv5gp31yqmMx4wBbKHOtGh1lhb5y6mq6IF+bnyp69kDgcja/ZTUA5d+wFt7rfh"*)(*]VB*) LegendFunction is applicable to SwatchLegend, LineLegend, and PointLegend, and it supports only named functions such as:
"Panel""Frame","Framed""DarkFrame""Frameless"
It can also be combined with other options:
Plot[{x, 2x}, {x,0,1},
 PlotLegends->Placed[SwatchLegend[Automatic, TraditionalForm/@{x, 2x},
  LegendFunction->"DarkFrame", RoundingRadius->0,
  Background->White,
  LegendMargins->{{15,10}, {5,5}}
 ], {0.45,0.25}]
]
%28%2AVB%5B%2A%29%28Legended%5BToExpression%5BFrontEndRef%5B%22F51e00bab-6156-4326-96cc-c087ddee792a%22%5D%2C%20InputForm%5D%2C%20Placed%5BSwatchLegend%5B%7BDirective%5BOpacity%5B1.%5D%2C%20RGBColor%5B0.24%2C%200.6%2C%200.8%5D%2C%20AbsoluteThickness%5B2%5D%5D%2C%20Directive%5BOpacity%5B1.%5D%2C%20RGBColor%5B0.95%2C%200.627%2C%200.1425%5D%2C%20AbsoluteThickness%5B2%5D%5D%7D%2C%20%7BBoxForm%60TeXForm%5BHoldForm%5Bx%5D%5D%2C%20BoxForm%60TeXForm%5B2%2AHoldForm%5Bx%5D%5D%7D%2C%20LegendMarkers%20-%3E%20Automatic%2C%20LabelStyle%20-%3E%20%7B%7D%2C%20LegendFunction%20-%3E%20%22DarkFrame%22%2C%20LegendLayout%20-%3E%20%22Column%22%2C%20LegendMargins%20-%3E%20%7B%7B15%2C%2010%7D%2C%20%7B5%2C%205%7D%7D%2C%20RoundingRadius%20-%3E%200%2C%20Background%20-%3E%20GrayLevel%5B1%5D%5D%2C%20%7B0.45%2C%200.25%7D%2C%20Identity%5D%5D%29%28%2A%2C%2A%29%28%2A%221%3AeJylUstuEzEUnfIm4lH6AUgsWEZKU5rSRTVq2qQgTVXIRIglHvtOasVjV360yQfwEbBlxxd0zRoQYsOGHWwQEoI%2FwNeuQJNQWHAXZ8bXx%2Fdx7r1VqEF5NkkSc9XDIw5H20CVJlbp%2FKL3ZDACydqR0vDQY9zfIbFcQN%2BSh75W0vYk602AOksKAfltdK8uQ6tVkKLZWV7tNO%2BstDvN9Q6lTdq6u8YYwNp6m5RnMMo5DwPn313CHyBsT4pp8A61gxkOlpGDABpSmfOYiggDscgLHh4IQoGVl%2FF8BdlHxNL92MvvYBk3Nr5B4jbXPiI%2FhNgXNr93QCi3U50E%2B55Gcihxp7ulhNL6%2BObTrw%2BP36Z6JdinVD9%2FhvYljWFueNgsjBLOwnCf07EEYziW8L%2BZy2DfUv3yx%2FvdYvFzqjcaH14cbLz6d%2Ba6AoF93UNXTfpKV0%2BG8Bi%2F8QJz3lOCocegZ3L6gxAXxzHkFZzkOi1IbaRh%2BeJ4dokegzZBmE1nVUUspzNsXICMFCByOxVQJrV26tRrvwL3nfQiK5kHyX2WvibVzGqFZYn0jEyVszluk9fbVfJvFY%2B4NDOq1k4c1eKNOe05ihXgD2UPlJOMy9GAMO4MT%2BZZGLBL6HikkRqlxu52NJlmcAiCL8yl1G9eo31MT3brXRqmc5%2BBtH7jfgK6kgDN%22%2A%29%28%2A%5DVB%2A%29 Labels can be styled using colors, FontFamily, and FontSize. LegendMargins accepts forms such as:
LegendMargins -> globalMarginLegendMargins -> {{left, right}, {top, bottom}}
Another feature is LegendLayout, which accepts "Row", "Column", "ReversedRow", and "ReversedColumn".
Plot[{x, 2x}, {x,0,1},
 PlotLegends->Placed[SwatchLegend[Automatic, {"x", "2x"},
  LegendFunction->"Frame",
  Background->White,
  LegendLayout->"Row"
 ], {0.45,0.5}]
]
(*VB[*)(Legended[ToExpression[FrontEndRef["Fad877441-0968-4571-8bf6-c847f6274742"], InputForm], Placed[SwatchLegend[{Directive[Opacity[1.], RGBColor[0.24, 0.6, 0.8], AbsoluteThickness[2]], Directive[Opacity[1.], RGBColor[0.95, 0.627, 0.1425], AbsoluteThickness[2]]}, {"x", "2x"}, LegendMarkers -> Automatic, LabelStyle -> {}, LegendFunction -> "Frame", LegendLayout -> {"Row", {Automatic, 5}}, Background -> GrayLevel[1]], {0.45, 0.5}, Identity]])(*,*)(*"1:eJylUr1O3EAQ9iUQAgqI5AEipaA8CS7O+SiQxc+BkIyAM0q/Xo9hdYsXza658wPwEKRNlyegTg0UNDQUSNAgJARvwP4AkY+CIlN8ssbfzHwz335LRCd773meHNfwk0FvCahAogTGIzoTwTbkacNRxjS0U6b/GWJWM7kvGpZR5Kqdp+0+0EKRhEM8ZdIkbQWB78/Up2ebrbr/I5ipt5KsWactP8iajcAP/Eb2znQZ0tApdN1H8wEkXc95abNbWMAAx8iIgQO1o+SwHcUlOJEfNGxwQiHNzALyk2H3iKI7bpd/zSImlasZ1bDEUHdk++D2MrXre4QyVaJn4z50ZCtxZWFRcIF49PXgdvPoNMTvNq5C/HVo4iZ0bT5rmE+k4IWCrR1GuzlIyYyE/52c2bgL8c/D2VoyeR3i3Nj57725v29PrlwgNux+bHKNfvXS9k24q60R7AJKq3e+UGKXKEYH2MaXiCTAY1VyyLzKnavUiZfGy0Wudxd5bG1EsjvgtvXPUSNSikINqDeH6YheNVuVyYYrS79oXSC0u42i0G+i9uzFCpIygn3grPbqUnhybOIifLLlMrSOrKaQK23WI+4x040="*)(*]VB*) Bar legend
BarLegend is a special type of legend used in contour plots and heatmaps. It can also exist on its own.
BarLegend["Thermometer", 3, LegendLabel->"Temperature"] (*VB[*)(FrontEndRef["F16a2fad3-916b-47f4-99fe-36e61c4cef89"])(*,*)(*"1:eJxTTMoPSmNkYGAoZgESHvk5KRCeEJBwK8rPK3HNS3GtSE0uLUlMykkNVgUJG5olGqUlphjrWhqaJemamKeZ6FpapqXqGpulmhkmmySnpllYAgCdNhYx"*)(*]VB*) The following options are supported:
LegendLabel, LabelStyle (which also styles ticks), and
ImageSize. For example, you can easily align a bar legend with your plot.
ContourPlot[(*FB[*)(((*SpB[*)Power[x(*|*),(*|*)2](*]SpB*) - (*SpB[*)Power[y(*|*),(*|*)2](*]SpB*))(*,*)/(*,*)((*SpB[*)Power[((*SpB[*)Power[x(*|*),(*|*)2](*]SpB*) + (*SpB[*)Power[y(*|*),(*|*)2](*]SpB*))(*|*),(*|*)2](*]SpB*)))(*]FB*) , {x,-1,1}, {y,-1,1}, Contours->4,
  PlotLegends->BarLegend[Automatic, ImageSize->{20,300}],
  ImageSize->{300,300},
  ColorFunction->"Rainbow",
  ClippingStyle->Automatic
]
%28%2AVB%5B%2A%29%28Legended%5BToExpression%5BFrontEndRef%5B%22F006c4a5b-5760-463d-88d5-2681b1515676%22%5D%2C%20InputForm%5D%2C%20Placed%5BBarLegend%5B%7BBlend%5B%22Rainbow%22%2C%20%231%5D%20%26%20%2C%20%7B-59%2F10%2C%2059%2F10%7D%7D%2C%20%7B%7B-4.6000000000000005%2C%20Directive%5BGrayLevel%5B0%5D%2C%20Opacity%5B0.5%5D%2C%20CapForm%5B%22Butt%22%5D%5D%7D%2C%20%7B-2.3000000000000003%2C%20Directive%5BGrayLevel%5B0%5D%2C%20Opacity%5B0.5%5D%2C%20CapForm%5B%22Butt%22%5D%5D%7D%2C%20%7B0.%2C%20Directive%5BGrayLevel%5B0%5D%2C%20Opacity%5B0.5%5D%2C%20CapForm%5B%22Butt%22%5D%5D%7D%2C%20%7B2.3000000000000003%2C%20Directive%5BGrayLevel%5B0%5D%2C%20Opacity%5B0.5%5D%2C%20CapForm%5B%22Butt%22%5D%5D%7D%7D%2C%20LabelStyle%20-%3E%20%7B%7D%2C%20LegendLayout%20-%3E%20%22Column%22%2C%20LegendMarkerSize%20-%3E%20300%2C%20ScalingFunctions%20-%3E%20%7BIdentity%2C%20Identity%7D%2C%20ImageSize%20-%3E%20%7B20%2C%20300%7D%2C%20Charting%60AxisLabel%20-%3E%20None%2C%20Charting%60TickSide%20-%3E%20Right%2C%20ColorFunctionScaling%20-%3E%20True%5D%2C%20After%2C%20Identity%5D%5D%29%28%2A%2C%2A%29%28%2A%221%3AeJzFVMtu2zAQVNz0FbRAG%2BQHcuitBuw0Ugz0kMaOXQRQm8IMei4lrZRFaDKgqDTq1%2BXS%2F%2BifuFzSViLV55SHhbg7nOEsltpP1Dx%2FEgRB%2BdqG7wg%2FTyFVmhul2XObiaEAmR14yI4N0wxtjYD5FuV2bZhpJc1UZtNbSCvDEwHsHaUHgyg95GHSD4%2BiQf8w%2BpD1R6Ms7B9Eo2EyDIdhdBTlPWLZtmFe2XMv6AN4di5F7bIXuoIOhq7BQEDqpMqnJMVFCf6Sz2z4JngKWU7A8qUNY669kXumGEvjHZDkrJKpQSV9nRjHwsJdC%2BYcZaJWdukoE8og7TpsvTXbnBMXF%2Fh7uVziToNs1T7aja9t%2F8uy3ukip7V7572Rl1PU1jnegL8QpT5rXsdwAwID4nN5uvn5NU%2FR1Dpw68%2FxfWXCr2dKLxjpjCuzWbX3yKrBav0Xr58eTZVm2D2lmCcgmKkF5MHmEXDQV80zjHmtKsNowidKVAvZQb5pkF%2B4vgLN8Bfg%2B62Hg9rgWGpnUBbrwS%2FbXXGjepaBNNZda9OhouacLXgBpNXmwD2a8A3y9MuYXHJtrP6Pk1ssXSNc%2FauSnddevn2IvsD0imHmH%2F0ci8tus%2FZ8b5ReG1v5bP4l7uRJbkC3bP0FlqUnXw%3D%3D%22%2A%29%28%2A%5DVB%2A%29 Let's make all ticks larger and limit their number.
ContourPlot[(*FB[*)(((*SpB[*)Power[x(*|*),(*|*)2](*]SpB*) - (*SpB[*)Power[y(*|*),(*|*)2](*]SpB*))(*,*)/(*,*)((*SpB[*)Power[((*SpB[*)Power[x(*|*),(*|*)2](*]SpB*) + (*SpB[*)Power[y(*|*),(*|*)2](*]SpB*))(*|*),(*|*)2](*]SpB*)))(*]FB*) , {x,-1,1}, {y,-1,1}, Contours->4,
  PlotLegends->BarLegend[Automatic, 3, ImageSize->{20,300}, LabelStyle->Directive[FontSize->14], LegendLabel->"f(x,y)"],
  ImageSize->{300,300},
  ColorFunction->"Rainbow",
  ClippingStyle->Automatic,
  FrameStyle->Directive[FontSize->14],
  FrameTicksStyle->Directive[FontSize->14],
  FrameTicks->{{-1,0,1}, {-1,0,1}}
]
%28%2AVB%5B%2A%29%28Legended%5BToExpression%5BFrontEndRef%5B%22F67834e22-9bb0-4e3c-9a36-7bb42f1cf51b%22%5D%2C%20InputForm%5D%2C%20Placed%5BBarLegend%5B%7BBlend%5B%22Rainbow%22%2C%20%231%5D%20%26%20%2C%20%7B-59%2F10%2C%2059%2F10%7D%7D%2C%203%2C%20LabelStyle%20-%3E%20Directive%5BFontSize%20-%3E%2014%5D%2C%20LegendLabel%20-%3E%20%22f%28x%2Cy%29%22%2C%20LegendLayout%20-%3E%20%22Column%22%2C%20LegendMarkerSize%20-%3E%20300%2C%20ScalingFunctions%20-%3E%20%7BIdentity%2C%20Identity%7D%2C%20ImageSize%20-%3E%20%7B20%2C%20300%7D%2C%20Charting%60AxisLabel%20-%3E%20None%2C%20Charting%60TickSide%20-%3E%20Right%2C%20ColorFunctionScaling%20-%3E%20True%5D%2C%20After%2C%20Identity%5D%5D%29%28%2A%2C%2A%29%28%2A%221%3AeJxtUtlOwzAQLJT7EiB%2BgAckkKgEbbnEE4UiIZVDCeIZ29mUFa4tOQ40%2FB%2FfVbw2LSTwssrujmc8E29zHaX1Wq2WrbryhPB%2BBUIbZrWJ592kB31QSTNAllzpJuh2BEynaLbpyrXRynZV0h2CyC3jEuIdGh%2BfnLba0Gw2zjg%2FaLShJRpnrHXcOOG83UwPRXp0yNNpYplxJcrduQX6AJbcK1n46aPJoYKha8QgQXipbJakmMwgXHLOlQfJBCTpMvWLrnSYCUZ%2BmHqY2eCAJK9zJSxqFfbE2JEO7iOIGCquv%2B3S0Vhqi9RV2KbHbBEjLibxczQa4dIEWdqdu8bvsF6iIos%2B6R7jIGNbSAjSZOQKjbONb5VIggf3E2L8AFz7y7c8%2BZWBlUJKd4f7xV4FuPILWOjceuSllvlAVZDrE%2BQtM69gvPT%2B1B9pwsXCGVb9ccpZOTh%2F%2B5sElEVblJoKFSVwM2B9IK0yB25Rkv%2FI0%2Fu8fGHGOv3niyFmPgC%2Fv9OqmuPGb%2FQjitcYk%2FDCIuy%2F2Ap6K2SjzdjYt8%2FJw%2FUnL1ILpmTrCxGk0wI%3D%22%2A%29%28%2A%5DVB%2A%29 Log and double Log plots
We finally fixed logarithmic plots!
LogPlot[x + Exp[x/10], {x,0,100}, Frame->True]
LogLogPlot[x + Exp[x/10], {x,0,100}, Frame->True]
(*VB[*)(FrontEndRef["Fe2235552-de54-4d7e-b71e-3aca9371eff4"])(*,*)(*"1:eJxTTMoPSmNkYGAoZgESHvk5KRCeEJBwK8rPK3HNS3GtSE0uLUlMykkNVgUJpxoZGZuamhrppqSamuiapJin6iaZG6bqGicmJ1oaA1lpaSYAlv8WHQ=="*)(*]VB*) (*VB[*)(FrontEndRef["F955cf35b-9a8d-496f-bcdd-ce7816e510ac"])(*,*)(*"1:eJxTTMoPSmNkYGAoZgESHvk5KRCeEJBwK8rPK3HNS3GtSE0uLUlMykkNVgUJW5qaJqcZmybpWiZapOiaWJql6SYlp6ToJqeaWxiapZoaGiQmAwCkFBaJ"*)(*]VB*) Copy as TeX and Copy as Input
We have two new context-menu items. Select an expression, right-click it, and copy it as ...
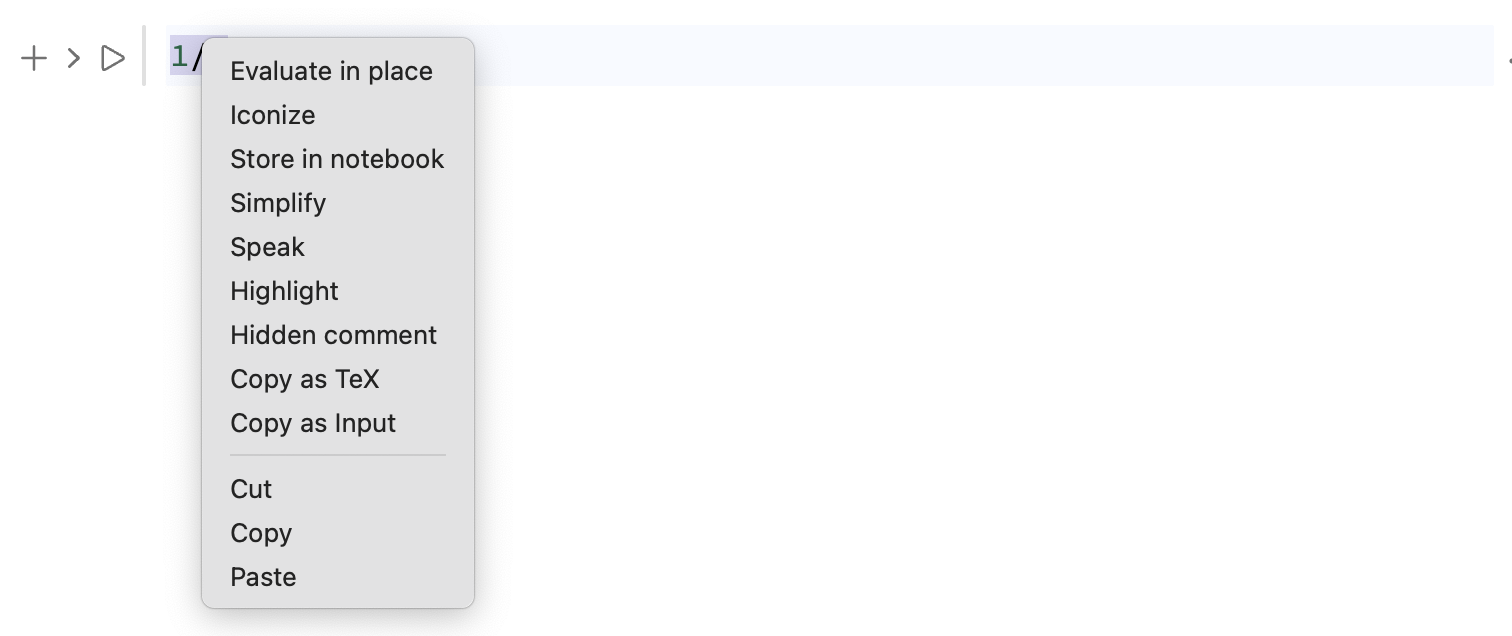
This uses a local kernel to evaluate and convert your expression to the corresponding form. Copy as TeX uses TeXForm, while Copy as Input evaluates an expression and strips decorative comments.
Overlay Expression
It might be useful in some cases, although not in this example.
Overlay[{1,4}] (*VB[*)(Null)(*,*)(*"1:eJxTTMoPSmNkYGAoZgESHvk5KRCeGJBwyq9wyy/KTfAvSy3KSawMy0wtBwqlMcFU+2QWl6Qxg3hcQMI1JbMkvwikKBhkgiFCXVBpTmowB4iRmpjin5dTCRYNKSpNRVMDMiY4NSc1uSQxKSe1mBXIdUvMKU7FaYkJFS0BAKjIPRk="*)(*]VB*) Better WLX form of Row, Column and Grid
We improved the output form of these wrappers used on markdown, slides and WLX cells. ImageSize, Alignment and Spacings can be used for WLX output as they are used now in a normal StandardForm (default wolfram output). For example:
Standard form
TestRow = Row[{1,2}, ImageSize->{300, Automatic}, Alignment->{{Left, Right}, Center}] (*GB[*){{1(*|*),(*|*)2}}(*||*)(*1:eJxdTssKAjEMrG88CP6Cd39iVRDB0xa81zWtgbaBpmXFr7ddBelewmQyM5ndnVo9E0LwJo8bQn+CjoKKFOQ8M+eADz0t97K1yQJvf/SBXo1F4x34+JdckWNtkKsMjmST81zrvgB05EXRonmOrQOgnvWkyq82Xpb8XALCqOk6g4tTBiS+oX6N+5wxCJoUyamI3Qefazud*)(*]GB*) WLX form
.wlx

<Row Alignment={{{Left, Right}, Center}} ImageSize={{Full, Automatic}}>
  <div>1</div>
  <div>2</div>
</Row>
<div class="flex flex-row" style="align-items:center;width:100%;"><div style="flex:1;display:flex;justify-content:flex-start;"><div >1</div></div>
<div style="flex:1;display:flex;justify-content:flex-end;"><div >2</div></div></div> This way is also supported:
.wlx

<TestRow/>
<div class="flex flex-row" style="align-items:center;width:300.000000000000px;"><div style="flex:1;display:flex;justify-content:flex-start;">1</div>
<div style="flex:1;display:flex;justify-content:flex-end;">2</div></div> The common case is to use it for presentations instead of manually constructing it from divs and CSS styles:
TestPlot = Plot[x, {x,0,1}]; .slide
## My Title
Some text here
<Row Alignment={{{Left, Right}, Center}} ImageSize={{Full, Automatic}}>
<div>
- Point 1
- Point 2
</div>
<TestPlot/>
</Row> <dummy >
## My Title
Some text here
<div class="flex flex-row" style="align-items:center;width:100%;"><div style="flex:1;display:flex;justify-content:flex-start;"><div >
- Point 1
- Point 2
</div></div>
<div style="flex:1;display:flex;justify-content:flex-end;">FrontEndExecutable[F682802cb-dd07-4759-bc08-a5081c9a3db0]</div></div></dummy> UI elements
Vertical slider and input box
Set Appearance to "Vertical" on InputRange to get a vertical slider.
InputRange[0,1, Appearance->"Vertical"] (*VB[*)(EventObject[<|"Id" -> "924e522c-1b9e-4c4b-bd4b-a28a63187faa", "Initial" -> 0, "View" -> "F6d947f06-c196-4b50-a9d2-061020df367c"|>])(*,*)(*"1:eJxTTMoPSmNkYGAoZgESHvk5KRCeEJBwK8rPK3HNS3GtSE0uLUlMykkNVgUJm6VYmpinGZjpJhtamumaJJka6CZaphjpGpgZGhgZpKQZm5knAwCQIBVY"*)(*]VB*) Or set it to "Number" to remove the slider and leave only the input box.
InputRange[0,1, Appearance->"Number"] (*VB[*)(EventObject[<|"Id" -> "469bca19-a898-4b7c-9796-cc82aeb1993b", "Initial" -> 0, "View" -> "F480c88f1-1ab6-40fc-88ce-24eb63206bdc"|>])(*,*)(*"1:eJxTTMoPSmNkYGAoZgESHvk5KRCeEJBwK8rPK3HNS3GtSE0uLUlMykkNVgUJm1gYJFtYpBnqGiYmmemaGKQl61pYJKfqGpmkJpkZGxmYJaUkAwCYwxYW"*)(*]VB*) New states of a button
You can set a button's state using an external symbol provided through the "StateExpression" option, allowing you to communicate certain actions happening behind the scenes to the user. The possible values are:
"Disabled","Off", orFalse— prevents button actions"Enabled","On", orTrue— enables normal behavior"Busy","Progress"— prevents button actions and shows a spinner icon
Here is an example:
state = True;
InputButton["Run", "StateExpression"->Offload[state]]
Let's disable it.
state = False; "StateExpression" is evaluated on the frontend, allowing you to derive the state from other expressions. For example, if you already have some kind of state field and want to disable a button when it has a particular value:
stateText = "Running";
TextView[stateText // Offload]
InputButton["Run", "StateExpression"->Offload[stateText =!= "Running"]]
Whenever you update stateText, the state is recomputed.
:::note Not every expression can be evaluated on the frontend; please consult the documentation. The interpreter supports only a very limited set of basic symbols. :::
More mouse events
We extended EventHandler for Graphics to support almost all mouse events, including:
"zoom"(also known as the wheel event)"click""altclick""rightclick""contextmenu""onload""mousemove""mouseover""mousedown""mouseup""mouseleave""mouseenter"
For individual graphics primitives—Disk, Rectangle, Inset, SVGGroup, Point, Polygon, Text, and Locator—it also supports:
"drag""dragall""dragsignal"
Here is an example using the newly added events:
EventHandler%5BPlot%5Bx%2C%20%7Bx%2C0%2C1%7D%5D%2C%20%7B%0A%20%20%22mouseleave%22%20-%3E%20%28Print%5BStringTemplate%5B%22Left%20at%20%60%60%22%5D%5B%23%5D%5D%26%29%2C%0A%20%20%22mouseenter%22%20-%3E%20%28Print%5BStringTemplate%5B%22Entered%20at%20%60%60%22%5D%5B%23%5D%5D%26%29%0A%7D%5D Improved AsyncFunction
Now it resolved Return statement correctly, i.e.
AsyncFunction[Null,
  If[ChoiceDialogAsync["Continue?"] // Await,
    Return["Yes"];
  ];
  "No"
][] // WaitAll
"Yes" WhileAsync
Following the same pattern as for TableAsync, DoAsync we implemented an equivalent for While. Here is an example:
i = 0;

WhileAsync[i < 10,
  i++;
  If[EvenQ[i], Continue[]];
  PauseAsync[0.1] // Await;
  If[i >= 7, Break[]];
] // WaitAll;

i
7 Bugs fixed
- Incorrect DPR when
Rasterizeor PDFExportis used (Electron 42 issue; an update is not possible because Electron 44 introduced more bugs in other areas). Solution: disable the buggy offscreen renderer and hide the window instead. - The
Textexpression breaks subscripts or superscripts ("x_{2}","x^{2}") when it receives an update. - The
zoomevent binding overrides themouseupevent. Spacer[]lacksWLXFormoutput.Equal,Unequal, and others are missing from the frontend interpreter, causing expressions insideOffloadto crash.ComplexPlotwith custom shading renders incorrectly because Texture is not provided. Cause:GraphicsComplexcannot contain both textured and plain-colored polygons. Solution: add this support.- Mini apps do not execute custom JS and HTML cell outputs on load. Solution: provide the notebook object to a window manager.
- Offloaded symbols cannot be assigned to new associations